Posts

Showing posts from September, 2020

Percent Infected Graphs Finally Available

Image
COVID-19 Weekly Update:  Graphs for my estimate of the % of the population that are actively infected are now finally available. They are not yet in the user interface for the web page, but you can view them from the git repository here: https://github.com/jlc42/jlc42.github.io/tree/master/figs/PercentActive I believe that this is the most useful statistic for determining the risk of a given activity. For example if you live in a location with 3% active, and you participate in an activity with 100 randomly chosen people, then on average, three people in that activity could be contagious.  Some examples: In the USA (taken as a whole) about 1.25% of the population is actively infected. So in a group of 100, you would expect just over 1 person to be contagious.  Some places in the US are significantly better than others: In Utah, the % infected is nearly 3%, so in a group of 100, we would expect around 3 people to be contagious.  In New Mexico, the % infected is 0.5%, so you would need a

COVID-19 Daily Update: Utah Status Report

Image
Utah is a good data point for the impact of school openings on COVID-19 case spread.  Utah opened schools in person mid August. At the time there was debate about whether opening schools would actually increase the spread of COVID-19 because children have more mild symptoms, and it was hoped that this also meant that they didn't spread the virus as well as adults.  We knew that this was likely true for children under 10, but we also knew that children over this age spread the virus as well as adults. Therefore, opening schools for older children, as well as colleges, should cause an increase in spread.  This is in fact what we can clear see in the Utah data: This is not a single one day noise spike. This trend is clearly visible in the average, over several days. Notice also that cases are rising faster than tests, so this is not the result of increased testing. Cases are now above tests in my figure. The scale is set such that when cases are above tests, that means that the percen

COVID-19 Daily Update, Public Health Compliance Data:

Image
Over the last week we have been talking about the mystery of second wave resistance across the US. After about 25% of the population is infected and recovered, there is remarkable resistance to a resurgence of the virus, even after states "reopen". This is mysterious because immunity thresholds should be around 66% if the R0 of SARS-CoV-2 is really around 3 as we believe. One likely explanation for this is that personal behavior is providing the additional protection. In the past I have used Google mobility data to characterize the level of physical distancing. But this only captures how much we are moving around, and can't capture how careful people are being. However, there is now some interesting polling data available that may capture some of these effects. Ryan Burge has provided excellent visualizations of the steps the American public is taking from the DFP COVID-19 Tracking Poll: (see: https://twitter.com/ryanburge/status/1301887909675569152/photo/1 ) Approximate

COVID-19 Daily Update: 200,000 dead in the USA

Image
 Today the USA passed 200,000 deaths.  World wide we are nearly at 1 million deaths.  Source: https://www.worldometers.info/coronavirus/country/us/   Early predictions back in March were that between 100,000 to 200,000 people might die from COVID-19 in the USA if we did nothing.  We didn't do nothing. But what we did was just as ineffective.  Now over 200,000 are dead, worse than the worst of the projections. There is a narrative that these projections were wrong... too "high".  It turns out that they were actually far too low.  They were wrong, in other ways. The assumed fatality rate was too high in the early models, but they under-estimated how many would be infected. They over estimated how quickly the disease would decline, and they severely over estimated the quality of our response. We failed, beyond the wildest imaginings of the worst case models from March. 

COVID-19 Daily Update: Failure was Not Inevitable

Image
Yesterday we discussed regions that were initially hard hit , to determine how resistant some of those places have been to a second wave, places like New York, Spain, France, and Italy.  Today we want to discuss regions that were not initially hard hit, where immunity levels are very low, and the virus has a lot of room to spread if it were to get out of control there.  Excellent examples of this would include New Zealand, South Korea, and even China, where their vigorous response prevented the virus from spreading extensively beyond Wuhan. Each of these countries, in their own way, demonstrated that failure was not inevitable, and that it was possible to control (and even completely eliminate) the virus. They also demonstrate that the economic cost of COVID-19 was best minimized by first aggressively controlling the virus.  However, recent rises in cases brought this narrative into doubt. In July/August each country saw new cases rise again. And with an almost entirely susceptible po

COVID-19 Daily Update: Fall Wave Watch

Image
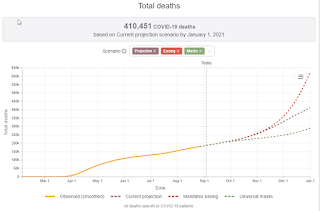
Predictions of Rt in the USA as a whole continue to be below 1 (currently 0.985), meaning that the rate of new cases are decelerating (you can thing of Rt as an estimate of the acceleration):  Despite this fact,  IHME is now predicting over 400,000 deaths by the end of the year, because of a proposed large second wave coming in the fall. But if new cases are currently slowing down, why would they predict that they would rise again in the fall?  Other historically more accurate models do not predict this same large second wave. IHME is predicting that daily deaths will rise between now and November, while COVID-19 Projections predicts that they will fall between now and November 1st.  The issues revolve around the surprising resistance to second waves that we have already seen in hard hit locations around the world. For example, in the US, the second peak of infections after the lockdowns were eased all happened in locations that were not initially hard hit.  The reasons for this resi

COVID-19 Daily Update: Status Update and Trends

Image
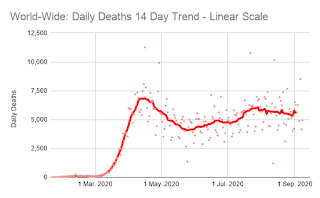
It's been a few weeks since I have done a simple status update.  World Wide: Yesterday the official death tole passed 900,000. They past 800,000 on the 21st of August, only 18 days ago. Daily deaths were falling slowly, but are back up now to roughly where they were. The longer term trends is that they are mostly holding steady at around 5,500 / day: Cases were falling slowly, but are back up now:  And that means that the daily change in the number of active cases is now positive again after briefly dipping into the negative territory. That means that there are more people actively infected today than there were yesterday, and that the spread of the disease is speeding up.  USA: Rt.live does not run their algorithm on the US as a whole, but when I do that, I find that the Rt for the US is 0.95, so new cases in the US are falling.  Daily deaths in the US remain high, but are also falling:  The 7 day average is being impacted by a holiday weekend again, and is not reliable. But befor

COVID-19 Daily Update, Cases Go Back Up

Image
Last week I wrote about how there have been surprisingly low cases are not climbing again in many locations that had a high first wave of disease. Most of the "second peak" of cases in the US were coming from new locations, which did not see an initial first wave of infections. I discussed why that was surprising, and gave several theories for why this might be happening.  This week, we need to revisit that, and discuss regions which were hit hard early on, but where cases are, indeed, starting to rise a second time.  One location like this is New York:  Daily new cases there appear to be on the rise again, and this does not appear to me to be due to increases in testing. Estimates of Rt in NY yesterday put it at around 1.06, and possibly climbing. On the whole, cases are still falling in the US, with an Rt estimate of 0.96. Before now, New York has consistently had a lower Rt than the rest of the US, but that is no longer the case.  We can see even more pronounced evidence

COVID-19 Daily Update: Communal Immunity Levels

Image
  In the last update, I promised that I would talk about immunity levels in the population next. I'm going to do that today, but I want to first show why it matters.  IHME vs. Youyang Gu, the Battle of the Models: The IHME model is now predicting 410,451 deaths in the USA from COVID-19 by the end of the year. They are making this prediction based on the assumption that there will be a large second wave in the fall, that is larger than either the first or the second peak in infections:  In contrast, Youyang Gu's model predicts no such thing. Unfortunately, Youyang Gu's model only predicts out to November 1st, and the large second wave predicted by IHME happens after that. The two models aren't really all that different up to November, and Youyang Gu refuses to predict anything further out because he claims (with good reason) that no one really knows what is going to happen that far ahead.  But even so, he's predicting a decline in daily deaths, while IHME is predic

DOVID-19 Daily Update: 6%, Estimating the True Fatalities, and Immunity Levels

Image
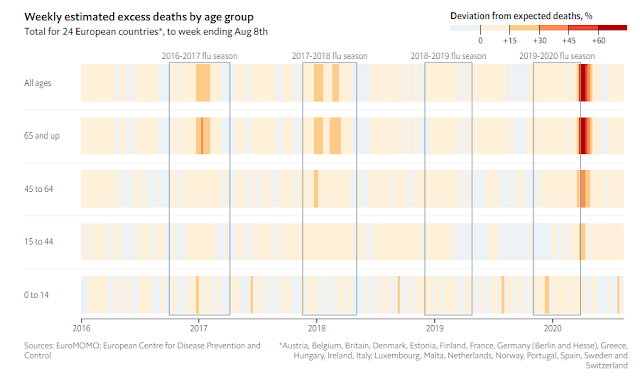
Estimating the True Fatalities from COVID-19: Given that misinformation on that CDC 6% figure is making the rounds, I figure it's worth talking (again) about estimating the true fatalities for COVID-19. The misinterpretation of the 6% figure is so obvious that I don't want to spend time on it here. But I do want to talk about what the true fatality burden might be (and how we might know). The first source of data is the reported deaths. But those are problematic in many ways.  For example:   How many people died at home of COVID-19, but were not counted?  Given the way COVID-19 creates "silent hypoxia" we have reason to suspect that the number who die at home, uncounted, is high.  But we can also ask: How many of those who die with complications from COVID-19 would have died anyway?  Despite the misinformation swirling around that question, at its hear it's not a completely unreasonable question to ask, since we know that COVID-19 primarily kills older people and

COVID-19 Daily Update for 9/1/2020:

Image
Blog Moved: I have been posting my daily COVID-19 updates to  my personal blog . But it now makes sense for this to have its own space. So I will be posting all future daily updates here.  Web Page in Diapers: We are creating a web page to house all the data analysis / modeling I'm doing for COVID-19. Right now it's in a very preliminary state, but I wanted to share the link now, before we clean it up. The link is likely temporary as well, since I expect we will eventually be using our own domain name.  Link:  https://jlc42.github.io/   Feedback is certainly welcome. Estimating Infections From Cases and Positivity Rates: Although this information is not yet available on the web page, I spent the morning generating figures with both confirmed cases, and estimated true infections, using the technique recommended  by Youyang Gu .   He proposed the following approach to estimate the true number of infections from the number of confirmed cases:  true-new-daily-infections = daily-con