COVID-19 Daily Update: Status Update and Trends
It's been a few weeks since I have done a simple status update.
World Wide:
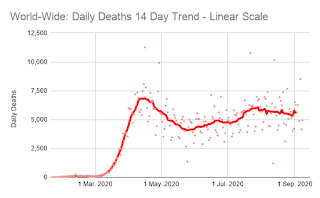
Yesterday the official death tole passed 900,000. They past 800,000 on the 21st of August, only 18 days ago.
Daily deaths were falling slowly, but are back up now to roughly where they were. The longer term trends is that they are mostly holding steady at around 5,500 / day:
Cases were falling slowly, but are back up now:
And that means that the daily change in the number of active cases is now positive again after briefly dipping into the negative territory.That means that there are more people actively infected today than there were yesterday, and that the spread of the disease is speeding up.
USA:
Rt.live does not run their algorithm on the US as a whole, but when I do that, I find that the Rt for the US is 0.95, so new cases in the US are falling.
Daily deaths in the US remain high, but are also falling:
The 7 day average is being impacted by a holiday weekend again, and is not reliable. But before the holiday reporting hit, the 7 day average was 801.


Is it possible that an aggregated Rt (for the whole US) is misleadingly optimistic? Consider this extreme hypothetical scenario: infection rate is constant across all 50 states today, and is dropping slightly in 49 states, but infections are doubling every 5 days in one state that has 2% of the national population, giving an overall Rt of 0.95. If that trend continues, then after 30 days, and 6 doublings, that one state will have more cases than the rest of the U.S. combined, and total US infections will have roughly doubled. Does the Rt model somehow handle this properly, or does it assume homogeneity throughout the country?
ReplyDelete